# Reports
Macula Console application provides an opportunity to send automatic reports. There are two types of them:
* Reports based on the counter data, which has been recorded with the video stream(s). Depending on the collected information context, these reports can be used, for example, to estimate the average number of customers during specific hours, compare the number of passing cars to the number of trucks etc. Counter information is collected from Macula video analytics, camera-side counters (for certain manufacturers) and software counters.
* Reports based on the facial recognition (FR) module data. These include the counted detections (by tag) and miscellaneous estimators (age, gender, temperature, sentiment, etc.).
The report configuration process is similar to the manual procedure of reporting in the Macula Monitor application, with the difference that here the settings are defined once and then are used by the Macula servers for automatic report generation.
There are three report types: **bar**, **line** and **pie** diagram. Regardless of the chosen type, all reports are based on the **counters** and have configurable report interval and days and times of interest. Counter values are compared for the given period and with the specified scale, and the results are then reflected in the chart of the selected type. Reports can be configured to be created **automatically** on a **daily**, **weekly** or **monthly** basis and then **emailed** to the specified email address.
{% hint style="danger" %}
Regardless of the report settings, the report will be emailed after the selected report interval has ended.
Example 1: the report interval is previous day with time filter set to 8AM to 6PM. The report will be emailed next day 12:01AM.
Example 2: the report interval is previous week with only working days selected (weekends deselected). The report will be emailed 12:01AM next Monday, i.e., when the week is over.
{% endhint %}
#### Prerequisites
Reporting in Macula Console is primarily aimed at automatic report sending via email. In order to achieve this, you need to **configure** a mail server for the emails to be sent through, according to the steps explained in the corresponding section of this document. You can do this prior or after the report setup. If you need a one-time report for a custom time interval, you are welcome to use the reporting function in the Macula Monitor application.
For a counters report to be created successfully, there must be some counter data present in the database. You can use Open VCA, camera-side VCA (for certain manufacturers) or software counters. Open VCA setup in Macula is described in a separate document provided by demand.
For the FR report to be created, you must have at least one channel being analyzed by facial recognition module for the specified period, and the target FR service must be connected.
#### Report Configuration
In order to start report setup, go to the *Configuration* section of Macula Console and choose *Reports* from the menu on the left. Press the *+ New report* button on the top panel to bring up the report configuration dialog box. There are two options: **new counters report** and **new external service report**. These two types differ slightly.
#### Reports Based On Counters
This type of report is based on camera-side VCA, Open VCA, or software counters. The configuration options are similar to those in Macula Monitor when you create a graph in the *Reports* section.
Specify the **reporting criteria** in the *Details* tab; the following settings are available:
| Setting | Description | Default Value |
| ---------------- | -------------------------------------------------------------------------------------------------------------------------------------------------------------------------------------------------------------------------------------------------------------------------------------------------------------------------------------------------------------------------------- | ----------------------- |
| Title | User defined title for the report | \[empty] |
| Report interval | Time interval to be represented in the report; can be previous day, week or month | Previous day |
| Week days filter | Days of the week to be included in the report (e.g., ignore weekends) | All days |
| Time filter | Target audit interval to be analyzed for each of the selected days | 12AM > 12AM (whole day) |
| Chart type | Diagram type: bar, line or pie | Line chart |
| Aggregation by | Scale factor for the target diagram - results can be presented for months, weeks, days, hours or minutes (also, the data can be aggregated by counters if the selected chart type is pie diagram) | Day |
| Value |
Counter value to be taken for each report time interval on the X axis (day etc.):
Absolute: actual counter value
Relative: difference compared to the previous interval
Average: arithmetic mean of the given interval
Minimum: minimal value during the given interval
Maximum: maximal value during the given interval
| Absolute |
| Sum counters | Choose whether you want each counter to be represented separately or all counters are to be added up (for bar and line type diagrams only) | Disabled |
| Automatic | Generate the report and send it automatically to the specified email | Disabled |
| Mail server | A pre-configured SMTP server to be used for email sending (the setting is revealed when automatic report sending is enabled) | \[none] |
| To | Email recipient the report to be emailed to; enter exactly one valid email address here (the setting is revealed when automatic report sending is enabled) | \[empty] |
Next, switch to the *Counters* tab: here, you can select the required counters from the list.
All the counters available in the system are listed here - from Open VCA, camera-side VCA (for certain manufacturers) and software counters as well - in case their data are present in the database.
{% hint style="info" %}
For the exact list of supported camera-side VCA counters, kindly contact our support engineers at .
{% endhint %}
When ready, hit the *OK* button in the bottom to save the report configuration based on your selected criteria. To edit and remove reports, use the corresponding buttons on the upper panel.
#### Reports Based External Service Data
This type of report is based on the data received from external services (specifically, **detections and attributes from the facial recognition** module instances). The configuration options are similar to those in Macula Monitor when you create a graph in the *FR* section. The logic is analogous to that of the counters reports, yet the settings are a bit different.
Specify the **reporting criteria** in the *Details* tab (other settings like target week days are available in the *Filters* tab). The following settings are available:
| Setting | Description | Default Value |
| --------------- | ---------------------------------------------------------------------------------------------------------------------------------------------------------- | ------------- |
| Title | User defined title for the report | \[empty] |
| Report interval | Time interval to be represented in the report; can be previous day, week or month | Previous day |
| Chart type | Diagram type: bar, line or pie | Line chart |
| Group by | Main report values (targets): can be tags, temperature, age, sentiment, or gender estimation | Tag |
| Aggregation by | Results can be aggregated by months, weeks, days, hours or minutes (for bar and line type diagrams only) | Day |
| Sum values | Choose whether you want each target group to be represented separately or all values are to be added up (for bar and line type diagrams only) | Disabled |
| Show labels | Display value labels on the chart | Disabled |
| File type | Choose between PDF or CSV | PDF |
| Automatic | Generate the report and send it automatically to the specified email | Disabled |
| Mail server | A pre-configured SMTP server to be used for email sending (the setting is revealed when automatic report sending is enabled) | \[none] |
| To | Email recipient the report to be emailed to; enter exactly one valid email address here (the setting is revealed when automatic report sending is enabled) | \[empty] |
The choice between absolute/relative/min/max/avg value is not present here; all values are relative, i.e., the chart reflects the value change since the previous aggregation interval.
Next, switch to the *Channels* tab: here, you can select the target channels. The report will include the recognition data from the specified channels.
On the *Filters* tab, you can limit the report sample range by (de)selecting various options. The filters include days, time of the day, and attributes from the external service detections:
* **Tags** from FR
* Temperature ranges from the readings that were received by FR (works for certain camera integrations; please refer to us for the exact vendor list)
* **Age**, **gender**, and **sentiment** estimators
* **Week days**: select **days of the week** that you want to be included in the report (e.g., ignore weekends) (all days are selected by default)
* **Day time interval**: choose the target **audit interval** to be analyzed for each of the days in the selected report interval
When ready, hit the *OK* button in the bottom to save the report configuration based on your selected criteria. To edit and remove reports, use the corresponding buttons on the upper panel.
#### Report Preview
After you have created a report, you can check how it will look like by using the *Preview* and *Test* buttons on the upper panel. The **preview** button will generate a report and display it on your screen; the **test** option will create a report and email it to the specified address in PDF format immediately. In either case, the report preview will be based on its configured time interval, so, if you get an empty report, make sure that counter data are present for the previous day, week or month, whichever specified.
{% hint style="info" %}
When you have created a new report and wish to test it, please wait about 10-30 seconds before pressing the *Test* button: this time is required to retrieve the counter information from the database.
{% endhint %}
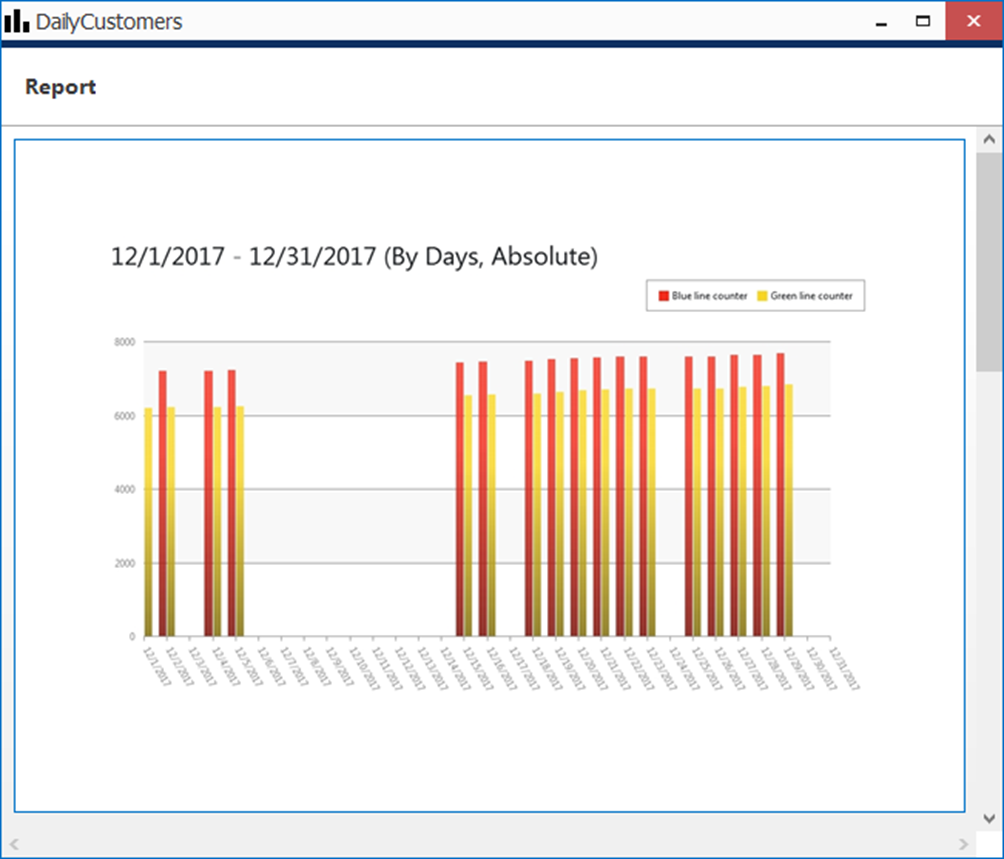
On each diagram, the **horizontal axis** (X) represents time in the specified scale, and the **vertical axis** (Y) reflects counter values. The counter values for each time interval are calculated based on the selected setting and can reflect absolute, relative, average, minimum or maximum counter value for the given interval. In the **pie diagram** type, each sector can represent either a time interval or a counter, depending on the aggregation setting parameter.
Each chart also contains a **legend** that provides information about colors used in the diagram:
* if you have selected to analyze every counter separately, each counter will be represented with its own color and the legend will reflect counter titles
* if you have chosen to sum the counter values:
* bar diagram will have just one column for each interval, every column consisting of specified counters and its total height reflecting the total
* line diagram will contain graphs for each individual counter and the total
* pie chart will reflect the counter sum for each time interval if aggregation by time intervals is chosen, so the legend will contain timestamps; if aggregation by counters is selected, the pie will reflect the proportion of the counter values for the whole selected audit interval
Apart from the diagram itself, each report in PDF format will also contain a table with the reference counter values.
#### Report Status Monitoring
Report execution status can be tracked from the *Monitoring* section of Macula Console, by choosing *Reports* in the menu on the left.
If a report has been sent at least once (by schedule, not as a test), the last execution time is shown here. For the reports that are currently set to be emailed automatically, the next (scheduled) execution time is also displayed.
#### Math Behind Counters
Different counter value settings will produce different results, so you need to understand which value to select in order to get the appropriate result. Below, you will find some details on how **these values are calculated** inside.
For each and every selected interval, five counter values are calculated: **absolute, relative, min/max, and average**. The minimal internal interval is equal to **1 (one) minute**; no matter how the counter value changes during that minute, these five values are recorded into the database. For longer periods (hours, days, etc), these values are calculated using the intermediate results.
In the snapshot below, there is an example of how the counter value might change during one minute, and what values are calculated based on these changes.
An example of counter changes within report interval with corresponding peak values
For correct report results, it is also essential to keep in mind whether the counter in question is increment-only, or if it is both incremented and decremented based on some events.
Counter value options:
1. **Absolute**
Absolute counter value is its exact value at the end of the measurement period. E.g., If the interval is 1h, the absolute counter value is equal to the absolute counter value for the last minute of that hour.
Usage examples:
* increment-only: estimate the total people flow, e.g., incoming customers
* increment/decrement: current number of people in the zone/building
2. **Minimum and maximum**
Here, simply takes the min and max value from the aggregation interval. For longer intervals, min/max are selected from the list of min/max of smaller periods (regular min/max function).
Note that min/max has nothing to do with absolute value: the counter value may peak inside the aggregation period with the total change (absolute value) being zero. The latter, of course, is only possible for the counters that are both incremented and decremented over time. For increment-only counters, max value will be equal to absolute value.
3. **Relative**
Relative counter value is the sum of all relative changes for the given period, or, even simpler, the difference between the current absolute value and the previous one. Relative value shows how much the counter value has changed for the given period compared to the previous one.
4. **Average**
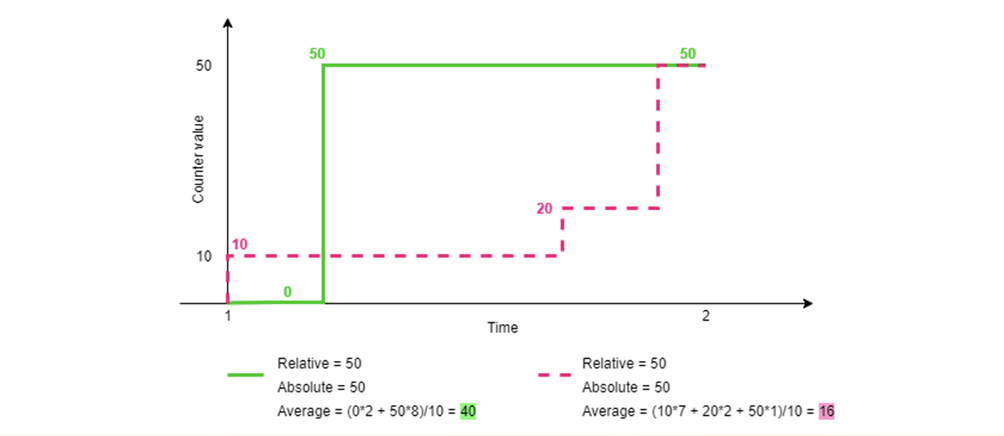
Average counter value is counted as weighted arithmetic mean, with the duration serving as weight.
Simple arithmetic mean would not be as useful as it does not take into account the value duration.
Consider the two examples in the snapshot below: two counters have the same absolute and relative values for the given period. Their arithmetic mean would be very similar (25 vs 26.6), while it is obvious that the first (green) counter value stayed higher for a longer period, and this should be taken into account.
Example of two counters with the same absolute values and different average
Usage example: average number of customers in the store per hour, average check total for estimating effectiveness.
### Audit Reports
#### Details
You can aggregate Audit events and send Audit reports to the dedicated e-mails. To do so, go to:
1. *Macula Console -> Configuration -> Reports*
2. Click on the *Arrow* down symbol besides the *+ New counters report* button and select the *New audit report* from the dropdown.
3. Inside the new pop-up window, add a meaningful *Title*
4. Set a *Minimum report interval* (5 minutes—100 days): Reports will be sent if something happens and the previous report was sent before the current interval.
5. Mark the *Enable empty report* checkbox to get reports even if no *Audit* *events* happened at the provided time interval.
6. Set the *Empty report interval* (5 minutes—100 days) to receive system health confirmation within the provided interval.
7. Mark the *Automatic* checkbox if you want reports to be sent automatically
8. Select the connected *Mail server* to send e-mails. Review the corresponding section of this manual to learn how to add an e-mail server to the Macula.
9. Add an e-mail address to receive reports.
#### Audit Events
Several categories of *Audit event* types can be monitored via *Audit reports*. Audit events include:
* Server events
* User Events
* Uncategorized
You can expand each category by clicking on the *Arrow* symbol to review and include preferred *Audit event* information in the aggregated *Audit report* by marking checkboxes before Event types. You can also include all the available *Audit events* by marking the checkbox at the top of the *Audit event* list.
To test your setup, confirm your settings with the *OK* button, Select your *Audit report* from the list, and click the *Test* button from the top panel. You should receive your *Audit report* shortly after.=
#### Troubleshoot
If you do not receive any reports, check if:
* The mailing server information is correct, and the service is still available (for example, Gmail can’t be configured as the mailing server starting with January 2025)
* You have *Audit events* to report, or an *Empty* *report* is enabled, and the report interval is completed.
* *Report interval* is greater than 5 minutes and less than 100 days
* The *Automatic* checkbox is marked.