# Audit
To access the global audit log in Macula Console, choose *Audit* section in the bottom-left-hand panel.
The audit log contains detailed information about the most important user activities and server events. Events are organized in a way similar to the Windows Event log, and can be filtered and sorted by any field just by clicking on the relevant field. By default, entries are sorted by time, with latest on top. Use *Search* field in the upper-right-hand menu to filter the records; press *Refresh* button to reload the item list.
{% hint style="info" %}
Please note that your actual audited events may vary depending on the software license edition.
{% endhint %}
The log has two sections: *Servers* and *Users*; these can be accessed by clicking the corresponding items in the menu on the left, when in the *Audit* section.
#### Servers
Each event contains the following values:
* **Time**: event timestamp in the system locale-specific format
* **Server**: name of the server from which the event originates
* **Class/subclass**: event category
* **Event**: a brief description of the event; see below for the detailed information about the logged event types
* Other relevant fields - **user, resource, data, info, misc. IDs,** : additional information relevant to the event, e.g., error details, target resource type
Double-click any event in the list to view the full information.
The following **events** are logged in this section:
* **Internal server events**
* **Audio output action completed**: an E\&A action to send audio to device was executed
* **Automatic backup failed**: an automatic backup was scheduled but failed for some reason
* **Automatic backup succeeded**: a scheduled backup copy of the databases was successfully created
* **Central server connected**: central server has successfully connected to the target recording server
* **Central server disconnected**: central server has disconnected from the target recording server because the target server is offline, unreachable, has been removed from the central server configuration or has invalid configuration
* **Configuration loaded**: configuration has been successfully loaded from the database and applied to the target server
* **Configuration Loading failed**: unable to load or apply server configuration
* **Configuration reset failed**: an attempt to reset the recording server configuration was made but failed for some reason
* **Configuration reset requested**: recording server configuration reset was requested via Macula Console (this message will be normally followed by another entry reflecting the rest status)
* **Configuration request succeeded**: recording server configuration was successfully reset
* **Configuration saved**: server configuration was saved to the database
* **Connected to mirroring server**: central server successfully connected to its configured mirror
* **Connected to recording server**: central server successfully connected to a recording server
* **Disconnected from mirroring server**: central server disconnected from its configured mirror (e.g., because the mirror is no longer available)
* **Disconnected from recording server**: central server disconnected from a recording server
* **Event action failed**: An E\&A action execution attempt was made but failed, double-click the event entry for details
* **Event action succeeded**: An E\&A action was successfully executed, double-click the event entry for details
* **External users added**: an attempt to add new external users via AD/LDAP was made, see additional information for status details
* **External users removed**: external users were removed from the server configuration
* **External users updated**: AD/LDAP user list was synchronized
* **Failover node activated**: failover server changed its state from *Idle* and received configuration to act instead of a recording server
* **Failover status changed**: server was included or excluded from a failover cluster, or its status changed from/to *Unknown* (see server health monitoring for details)
* **Number of external users exceeded maximum allowed**: the number of imported AD/LDAP users exceeds maximum allowed by the license
* **Open VCA notification received**: server VCA engine event (e.g., VCA license error)
* **Remote update initiated**: remote software update was initiated via Macula Console
* **Server restarted by watchdog for maintenance**: server was restarted by the watchdog service (double-click the event entry for the details about restart reason)
* **Server started**: Macula server service started
* **Server stopped**: Macula server service stopped
* **Synchronization completed**: central server has successfully synchronized configuration data with the target recording server
* **Resource access**
* **Archive**
* **Bookmark added**: a bookmark was added to the target channel on behalf of the server (via E\&A action, no user interaction)
* **Uncategorized**
* **Permissions updated**: user permissions were edited, double-click the event entry for details
* Recording Error: Unable to save video stream from particular channel
* Recording Recovered: video stream recording recovered
Double-click any event to open it in a separate dialog box with **additional information** about event source, such as: backup file path for the *Automatic backup* event, error code for the *Open VCA notification* event etc.
#### Users
The events related to user input (configuration via Macula Console, resource access via client applications) are available here. Some of these (mostly configuration related) are triggered by user actions in Macula Console and some (mostly related to resource access) are based on user actions in Macula Monitor. The following **events** are logged in this section:
* **Events & Actions**
* **Rule modifiers**: events related to rule schedules and conditions
* Event **condition** added/removed/updated: a condition was modified
* Event **schedule** added/removed/updated: a schedule was modified
* Event **schedule item** added/removed/updated: an individual schedule item was modified
* **Action** added/removed/updated: an E\&A action was modified
* **Event** added/removed/updated: an E\&A event was modified
* Event-action **rule** added/removed/updated: a rule in the E\&A table was modified
* **Global event** added/removed/updated: a global event was modified
* **Mail server** added/removed/updated: an SMTP server in E\&A configuration was modified
* **External services**: events associated with external services operating via HTTP API, such as FR and LPR and VDS
* **External service** added/removed/updated: external service connection was modified
* **External service group** added/removed/updated: a group for external services was modified via Macula Console
* **Failover management**
* Failover cluster added/removed/updated: failover cluster settings were modified via Macula Console
* **Installation**: events related to software installation and upgrade
* Remote update requested: a user has requested remote server update via Macula Console (usually followed by the *Remote update initiated* event entry in the *Server* audit section)
* **Recording**: changes to recording setup via Macula Console
* Recording **configuration** added/removed/updated
* Recording **profile** added/removed/updated
* Recording **schedule** added/removed/updated
* Recording **schedule item** added/removed/updated
* **Resource access**: user actions concerning all types of resource access from connected clients
* **Archive**: playback related events triggered from different Macula Monitor playback modes
* Archive **replication** accessed: recordings from a channel replica were accessed
* Archive **search** accessed: recordings from a channel were accessed
* Archive **snapshot** exported: a single or multichannel snapshot was exported from one of the archive playback modes
* Archive **timeline** accessed: archived data was accessed in a playback mode that has timeline
* Archived **data** **accessed**: available recordings from a channel were played back
* Archived **data exported**: a video clip was exported (double-click the event entry for details)
* **Bookmark** added/removed: a new bookmark was appended to the channel timeline or deleted from it
* **Bookmark popup** confirmed: bookmark popup caused by E\&A action was approved by a user via Macula Monitor application
* **Bookmark search** accessed: bookmark was searched from the Macula Monitor playback mode
* **Live**
* **Audio input** received from device: audio IN was activated from live view
* **Audio output** sent to device: audio OUT was activated from live view
* **External data** accessed: information from *Data sources* was streamed with live video
* **Layout** added/removed/updated: a layout was modified in Macula Monitor
* **Live data** accessed: live video stream was displayed
* **Motion data** accessed: motion information was streamed with live video
* **VCA data** accessed: Open VCA metadata was streamed with live video
* **PTZ**: pan, tilt, zoom, focus, iris related actions, as well as PTZ presets and tours for the target channel
* **Navigate**: PTZ event from older database versions (backward compatibility)
* PTZ **auto-focus/auto-iris** activated: device automatic focus/iris feature was activated
* PTZ **focus/iris** started/stopped: device manual focus/iris capability was used
* PTZ **pan/tilt started**: device was panned/tilted
* PTZ **pan/tilt stopped**: this event is generated after five seconds after the last pan/tilt command (after the PTZ control was released)
* PTZ **preset** saved/activated/deleted: PTZ preset was accessed
* PTZ **tour** saved/activated/deactivated/deleted: PTZ tour was accessed
* PTZ **zoom** **started**: device zoom IN/OUT capability was used
* PTZ **zoom stopped**: this event is generated after five seconds after the last zoom IN/OUT command (after the PTZ control was released)
* **User defined**: this event is generated when an audit entry is created based on a user-defined E\&A action *Write to audit log*
* **Video walls**: events based on video wall related user actions in Macula Monitor via *Resources* panel and/or *Video Walls* section
* Video wall **current layout saved as startup**: the currently displayed layout was set as startup for the target video wall display via video wall management
* Video wall **layout saved as startup**: a layout was set as startup for the target video wall display
* Video wall **layout sequence paused**: the layout sequence currently assigned to a video wall display was stopped
* Video wall **layout sequence set**: a pre-saved layout sequence was assigned to a video wall display
* Video wall **layout set**: a pre-saved layout was assigned to a video wall display
* Video wall **object popped up**: an E\&A action that displays an object (channel/map/layout) an a video wall screen has been executed
* Video wall **viewport** updated: an individual viewport contents was changed within a layout of a video wall display
* **Copied exported items**: exported files were copied from the Macula Monitor library to an external destination
* **External data** **search** accessed: archived information from *Data sources* was searched from Macula Monitor
* **External service** **search** accessed: archived external service data was searched from Macula Monitor
* **Live snapshot** exported: a snapshot was saved from the Macula Monitor live view mode
* **VCA search** accessed: archived VCA data was searched from the Macula Monitor playback mode
* **Resource administration**: resource related events caused by user actions in Macula Console management application
* **Channels**
* Channel **added/removed/updated**: target channel was modified in the described manner
* Channel **attached/detached**: target channel was attached to/detached from its device
* Channel **enabled/disabled**: target channel was activated/deactivated
* Device **channel** **group** added/removed/updated: a channel group was modified in the described manner
* **Data sources**
* **Data source** added/removed/updated: a serial data source was modified in the described manner
* **Data source profile** added/removed/updated: a profile for the data source was modified
* **Devices**
* **Administer**: device management event from older database versions (backward compatibility)
* **Device** added/removed/updated: a device was modified in the described manner
* **Device group** added/removed/updated: a device group was modified in the described manner
* **Layouts** and layout templates
* **Layout template** added/removed/updated: a layout grid was modified
* **Layout group** added/removed/updated: a group for shared layouts was modified
* **Live podcasts**
* Live podcast **added/removed/updated**: a live broadcast was modified
* Live podcast **enabled/disabled**: a live broadcast was activated/deactivated
* **Maps**
* **Geo map** added/removed/updated: a map based on the world map was modified
* **Map** added/removed/updated: a picture-based map was modified
* **Map group** added/removed/updated: a map/geo map group was modified
* **Map item** added/removed/updated: an individual map item (e.g., channel marker) was modified on a map/geo map
* **Networks**
* Network **added/removed/updated**: a network connection was modified
* **Folders**
* Folders **added/removed/updated**: a folder was modified
* **Servers**
* **Connection** updated: server connection (IP, port, SNMP settings) was modified (it is added/removed together with the server)
* **Server** added/removed/updated: a server was modified in the Macula Enterprise configuration
* Server **configuration backed up**: server configuration was backed up manually via wizard (this event is only logged if the backup was run while Macula server was stopped)
* Server **configuration** **restored**: server configuration was restored manually via wizard (this event is only logged if the wizard was run while Macula server was stopped)
* **Server group** added/removed/updated: a server group was modified
* **Software counters**
* Software counter added/removed/updated
* **User buttons**
* **User button** added/removed/updated: a user button was modified
* **User button group** added/removed/updated: a user button was modified
* **Video walls**
* **Video wall** added/removed/modified: a video wall was modified
* **Video wall group** added/removed/updated: a video wall was modified
* **Visual groups**
* **Visual group** added/removed/modified: a visual group was modified
* Access control added/removed/updated, enabled/disabled
* OPC client added/removed/updated, enabled/disabled
* **Server security**: events related to server security, access and permission/policy/user management
* **Administration permissions** updated: administrative permissions for Macula Console access were modified for a user or a user group
* **Audit log** accessed: the *Audit* section of Macula Console was accessed
* **Confirmed server warning** notification: a popup warning from the server E\&A action was confirmed in Macula Monitor
* **External user group** added/removed/updated: AD/LDAP user group was modified
* **Client connection** permissions updated: administrative permissions related to remote client access were modified
* **Log in**: a user has successfully logged into the target server
* **Log out**: a user has logged out of the server or his session timed out
* **Monitoring data** accessed: the *Monitoring* section of Macula Console was accessed
* **Object added** to group: some object in the server configuration was added into a group of the corresponding type
* **Object removed** from group: some object in the server configuration was deleted from a group of the corresponding type
* **Permissions** added/removed: user permissions were modified
* **Security policy** added/removed/updated: server security policy was modified
* **Unsuccessful log in**: a user has attempted to log into the server without success
* **User** added/removed/updated: a user account was modified
* **User group** added/removed/updated: user group settings were modified
**Double-click** an event entry to see **details** about the related resource, such as: resource name, the user who did the changes or executed the action, destination path for the copied exported files etc.
#### Problems
This section is a filter: it contains important messages from Servers and Users sections, which indicates **that the system has a potential problem**. For example, messages about system suspension indicate that some system setting cause system suspension, and this behavior may cause server freezes and gaps in the video archive.
List of potentially problematic errors:
* **Recording Error**: Unable to save video stream from particular channel
* **Configuration Loading failed**: unable to load or apply server configuration
* **Server restarted by Watchdog**: Critical server restart
Use the buttons in the upper panel:
* *Clear*: discard all entries and remove them from the problem list
* *View*: open the item details
* *Reset*: restore all log messages that are considered problems
* *Export to CSV*: save the list of problems and their details into a comma-separated-value format file
The number in the red circle next to the section name indicates the number of logged problems.
#### Define Filters
Server and user audit logs can be filtered for easier analysis. Click the *Define filter* button on the upper panel to bring up the dialog box.
Available filters:
* by period
* by event
* by server
* by resource
* by user (only for the user-initiated events, *Users* tab)
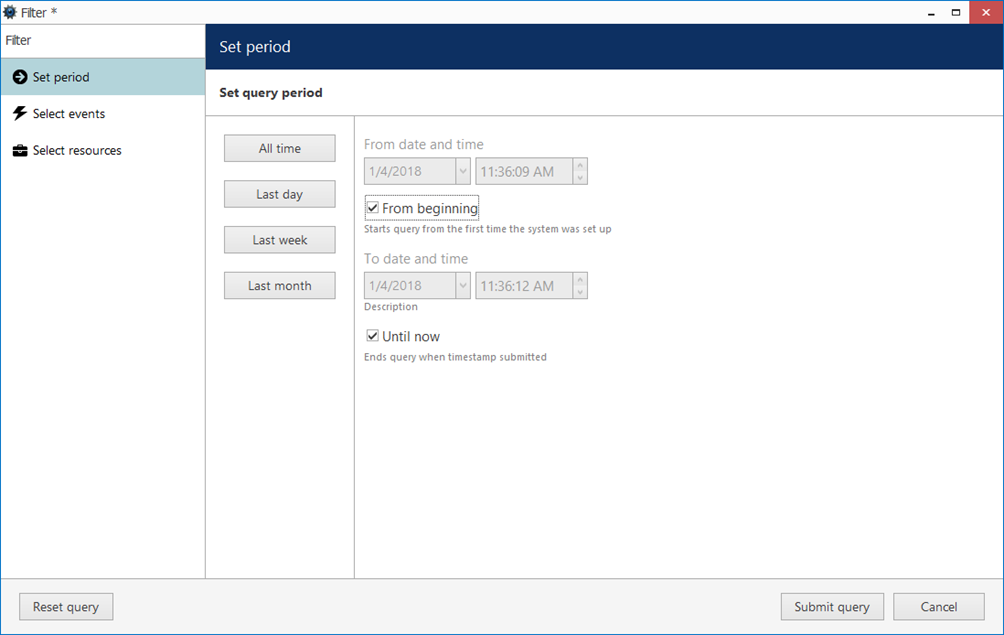
In the *Set period* tab, specify the time limits for log output. You can set the date and time manually or use automated controls for preset time boundaries: last day/week/month, the whole time, and also set start/end boundaries equal to the log beginning/end.
In the *Select events* tab, choose specific event types to narrow down the search. Note how the choice differs for the *Servers* and *Users* log filters.
In the *Select users* and *Select servers* tabs, you can choose target servers and users, who initiated the event. Note that if you want to search for events where a user was a target (e.g., user permissions changed), you need to select that user in the *Select resources* tab.
{% hint style="info" %}
Selecting **resources** will search for them in the additional event fields (i.e., events where these resources were a target). If you want to see events that were initiated by a specific **user** and/or on a specific **server**, choose them in the corresponding tabs - *Select servers* and *Select users*.
{% endhint %}
In the *Select resources* tab, you can choose which resources will be mentioned in the log entries. Note that if multiple resources are chosen, the filter will apply *OR* logic, meaning that output log will only be displayed if it contains log entries for **at least one** specified resource, and not for the combination of all specified resources.
Use the *Search* field to filter the resource list; both the list of *Resources in query* and general *All resources* will be affected by the *Search* filter. Press the *Reset query* button in the bottom left corner at any time to restart filter configuration; when you have finished, click *Submit query* to view the results. To discard filtering, simply switch to a different section in the menu on the left and then switch back to your desired section.
#### Detailed Audit
To track user activity in the archive playback mode of Macula Monitor, you can enable a *Detailed Archive Access Audit* and its intervals. By default, the feature is disabled. The default value for *Archive Access Audit Interval* is 15 minutes.
**Setting up archive access audit and its intervals**
To start logging user activity in *Archive Playback* mode, you need to turn the feature on:
1. In the left bottom panel - click on the *Configuration* tab
2. Select *Servers* on the left and double-click on your chosen server
3. Pick up storage in the popup window
4. Mark checkbox *Enable Detailed Archive Access Audit*
5. Set up your logging interval
Accessing logs
After you turn on playback audit logging, you can access log information in Macula Console:
1. In the left-bottom panel, select the *Audit* tab
2. In the left-top panel, click on *Users* and check for user activity
3. Double-click on the event you are interested in or select the event and use the *View* button on top
#### Reviewing log details
In the event detail window, you can find many details, including:
* Time - when the record was accessed
* User ID and User name - who accessed the record
* Channel ID/Channel Title - What channel was accessed
* Time from/Time to - what recording interval was accessed
* Remote address - IP and port of the particular machine that was used to access the recording
#### Logged Events
Events logged with enabled *Detailed Archive Access Audit*:
* **User Archive Data Display Accessed** - reviewing archive record time range
* **User Archive Data Export Accessed** - archived record video export attempts
* **User Archive Data Export Snapshot Accessed** - snapshot export attempts